The purpose of this document is to show how GC pressure must be taken into account when designing java batch systems that move significant amounts of data.
When moving data from source to target, we might think intuitively that creating bigger batches of data might be faster because it will reduce the total number of iterations we must perform. It can be true until a certain point, however once we reach some threshold we will start having dismissing returns because of GC pressure.
I’ll cover this with an example of some java code that generates a given number of lines in batches and writes them to a file. I’ll run the code using different parameters to get execution times, and will look at GC details for each run.
The code
I will focus on the core part of the code for simplicity.
public void test(long size, int batch) throws Exception {
    validate(size, batch);

    var total = 0;
    var temp = Files.createTempFile("benchmark", ".file");

    long t0 = System.nanoTime();

    try (var bw = new BufferedWriter(Files.newBufferedWriter(temp, StandardOpenOption.DELETE_ON_CLOSE), 8 * 1024)) {
        do {
            var lines = generate(batch);
            for (var l : lines) {
                bw.write(l);
                bw.newLine();
            }
            total += lines.size();
        } while (total < size);
    }

    long t1 = System.nanoTime();
    System.out.println("batch: " + batch + ", total: " + total + ", time: " + (t1 - t0) / 1_000000);
}

private void validate(long size, int batch) { /* Do validation */ }

private List<String> generate(int n) {
    var list = new ArrayList<String>();
    for (int i = 0; i < n; i++) {
        list.add("item" + UUID.randomUUID().toString()); // 40 bytes
    }
    return list;
}
Enter fullscreen mode Exit fullscreen mode
JVM & machine specs
The application ran with the following specs:
openjdk version “17.0.5” 2022-10-18
OpenJDK Runtime Environment GraalVM CE 22.3.0 (build 17.0.5+8-jvmci-22.3-b08)
Chip: Apple M1 Pro
Total Number of Cores: 8 (6 performance and 2 efficiency)
Memory: 32 GB
First execution (Big batch size)
- Total size: 30000000
- Batch size: 100000
- Iterations: 30000000/100000=300
$ java -Xmx3g -verbose:gc Benchmark.java 30000000 100000
[0.054s][info][gc] Using G1
[0.445s][info][gc] GC(0) Pause Young (Normal) (G1 Evacuation Pause) 25M->7M(516M) 2.760ms
[0.595s][info][gc] GC(1) Pause Young (Normal) (G1 Evacuation Pause) 37M->14M(516M) 3.502ms
[0.704s][info][gc] GC(2) Pause Young (Normal) (G1 Evacuation Pause) 70M->16M(516M) 2.144ms
[1.164s][info][gc] GC(3) Pause Young (Normal) (G1 Evacuation Pause) 314M->11M(516M) 0.734ms
[1.633s][info][gc] GC(4) Pause Young (Normal) (G1 Evacuation Pause) 315M->15M(516M) 1.584ms
[2.087s][info][gc] GC(5) Pause Young (Normal) (G1 Evacuation Pause) 315M->11M(516M) 0.661ms
[2.540s][info][gc] GC(6) Pause Young (Normal) (G1 Evacuation Pause) 315M->16M(516M) 1.442ms
[2.998s][info][gc] GC(7) Pause Young (Normal) (G1 Evacuation Pause) 316M->11M(516M) 0.612ms
[3.457s][info][gc] GC(8) Pause Young (Normal) (G1 Evacuation Pause) 315M->15M(516M) 1.281ms
[3.928s][info][gc] GC(9) Pause Young (Normal) (G1 Evacuation Pause) 315M->11M(516M) 0.663ms
[4.388s][info][gc] GC(10) Pause Young (Normal) (G1 Evacuation Pause) 315M->15M(516M) 1.311ms
[4.844s][info][gc] GC(11) Pause Young (Normal) (G1 Evacuation Pause) 315M->11M(516M) 0.675ms
[5.301s][info][gc] GC(12) Pause Young (Normal) (G1 Evacuation Pause) 315M->15M(516M) 1.333ms
[5.759s][info][gc] GC(13) Pause Young (Normal) (G1 Evacuation Pause) 315M->11M(516M) 0.642ms
[6.216s][info][gc] GC(14) Pause Young (Normal) (G1 Evacuation Pause) 315M->16M(516M) 1.346ms
[6.671s][info][gc] GC(15) Pause Young (Normal) (G1 Evacuation Pause) 316M->11M(516M) 0.723ms
[7.133s][info][gc] GC(16) Pause Young (Normal) (G1 Evacuation Pause) 315M->16M(516M) 1.533ms
[7.594s][info][gc] GC(17) Pause Young (Normal) (G1 Evacuation Pause) 314M->11M(516M) 0.609ms
[8.054s][info][gc] GC(18) Pause Young (Normal) (G1 Evacuation Pause) 315M->16M(516M) 1.364ms
[8.512s][info][gc] GC(19) Pause Young (Normal) (G1 Evacuation Pause) 316M->11M(516M) 0.747ms
[8.975s][info][gc] GC(20) Pause Young (Normal) (G1 Evacuation Pause) 315M->16M(516M) 1.403ms
[9.439s][info][gc] GC(21) Pause Young (Normal) (G1 Evacuation Pause) 316M->11M(516M) 0.686ms
[9.897s][info][gc] GC(22) Pause Young (Normal) (G1 Evacuation Pause) 315M->16M(516M) 1.318ms
[10.355s][info][gc] GC(23) Pause Young (Normal) (G1 Evacuation Pause) 316M->11M(516M) 0.754ms
[10.811s][info][gc] GC(24) Pause Young (Normal) (G1 Evacuation Pause) 315M->16M(516M) 1.298ms
[11.269s][info][gc] GC(25) Pause Young (Normal) (G1 Evacuation Pause) 314M->11M(516M) 0.634ms
[11.723s][info][gc] GC(26) Pause Young (Normal) (G1 Evacuation Pause) 315M->16M(516M) 1.300ms
[12.178s][info][gc] GC(27) Pause Young (Normal) (G1 Evacuation Pause) 316M->11M(516M) 0.597ms
[12.637s][info][gc] GC(28) Pause Young (Normal) (G1 Evacuation Pause) 315M->16M(516M) 1.331ms
[13.091s][info][gc] GC(29) Pause Young (Normal) (G1 Evacuation Pause) 316M->11M(516M) 0.636ms
[13.553s][info][gc] GC(30) Pause Young (Normal) (G1 Evacuation Pause) 315M->16M(516M) 1.376ms
batch: 100000, total: 30000000, time: 13195
Enter fullscreen mode Exit fullscreen mode
The whole execution took 13195ms, while the sum of all GC pauses took 36.999ms
First execution (Small batch size)
- Total size: 30000000
- Batch size: 1000
- Iterations: 30000000/1000=30000
$ java -Xmx3g -verbose:gc Benchmark.java 30000000 1000
[0.004s][info][gc] Using G1
[0.251s][info][gc] GC(0) Pause Young (Normal) (G1 Evacuation Pause) 25M->7M(516M) 2.864ms
[0.410s][info][gc] GC(1) Pause Young (Normal) (G1 Evacuation Pause) 37M->8M(516M) 2.859ms
[0.546s][info][gc] GC(2) Pause Young (Normal) (G1 Evacuation Pause) 88M->8M(516M) 7.700ms
[0.994s][info][gc] GC(3) Pause Young (Normal) (G1 Evacuation Pause) 312M->8M(516M) 0.932ms
[1.446s][info][gc] GC(4) Pause Young (Normal) (G1 Evacuation Pause) 312M->8M(516M) 0.987ms
[1.906s][info][gc] GC(5) Pause Young (Normal) (G1 Evacuation Pause) 312M->8M(516M) 1.007ms
[2.350s][info][gc] GC(6) Pause Young (Normal) (G1 Evacuation Pause) 312M->8M(516M) 1.145ms
[2.795s][info][gc] GC(7) Pause Young (Normal) (G1 Evacuation Pause) 312M->8M(516M) 0.878ms
[3.236s][info][gc] GC(8) Pause Young (Normal) (G1 Evacuation Pause) 312M->8M(516M) 0.911ms
[3.678s][info][gc] GC(9) Pause Young (Normal) (G1 Evacuation Pause) 312M->8M(516M) 0.920ms
[4.124s][info][gc] GC(10) Pause Young (Normal) (G1 Evacuation Pause) 312M->8M(516M) 0.937ms
[4.573s][info][gc] GC(11) Pause Young (Normal) (G1 Evacuation Pause) 312M->8M(516M) 0.904ms
[5.021s][info][gc] GC(12) Pause Young (Normal) (G1 Evacuation Pause) 312M->8M(516M) 0.941ms
[5.464s][info][gc] GC(13) Pause Young (Normal) (G1 Evacuation Pause) 312M->8M(516M) 0.990ms
[5.909s][info][gc] GC(14) Pause Young (Normal) (G1 Evacuation Pause) 312M->8M(516M) 0.981ms
[6.353s][info][gc] GC(15) Pause Young (Normal) (G1 Evacuation Pause) 312M->8M(516M) 1.009ms
[6.798s][info][gc] GC(16) Pause Young (Normal) (G1 Evacuation Pause) 312M->8M(516M) 1.251ms
[7.247s][info][gc] GC(17) Pause Young (Normal) (G1 Evacuation Pause) 312M->8M(516M) 0.508ms
[7.693s][info][gc] GC(18) Pause Young (Normal) (G1 Evacuation Pause) 312M->8M(516M) 0.601ms
[8.142s][info][gc] GC(19) Pause Young (Normal) (G1 Evacuation Pause) 312M->8M(516M) 0.539ms
[8.591s][info][gc] GC(20) Pause Young (Normal) (G1 Evacuation Pause) 312M->8M(516M) 0.490ms
[9.044s][info][gc] GC(21) Pause Young (Normal) (G1 Evacuation Pause) 312M->8M(516M) 0.609ms
[9.489s][info][gc] GC(22) Pause Young (Normal) (G1 Evacuation Pause) 312M->8M(516M) 0.575ms
[9.938s][info][gc] GC(23) Pause Young (Normal) (G1 Evacuation Pause) 312M->8M(516M) 0.525ms
[10.388s][info][gc] GC(24) Pause Young (Normal) (G1 Evacuation Pause) 312M->8M(516M) 0.614ms
[10.835s][info][gc] GC(25) Pause Young (Normal) (G1 Evacuation Pause) 312M->8M(516M) 0.501ms
[11.284s][info][gc] GC(26) Pause Young (Normal) (G1 Evacuation Pause) 312M->8M(516M) 0.628ms
[11.736s][info][gc] GC(27) Pause Young (Normal) (G1 Evacuation Pause) 312M->8M(516M) 0.522ms
[12.189s][info][gc] GC(28) Pause Young (Normal) (G1 Evacuation Pause) 312M->8M(516M) 0.488ms
[12.635s][info][gc] GC(29) Pause Young (Normal) (G1 Evacuation Pause) 312M->8M(516M) 0.559ms
[13.078s][info][gc] GC(30) Pause Young (Normal) (G1 Evacuation Pause) 312M->8M(516M) 0.550ms
batch: 1000, total: 30000000, time: 12876
Enter fullscreen mode Exit fullscreen mode
The whole execution took 12876ms, while the sum of all GC pauses took 34.925ms
Comparing numbers
Surprisingly, the execution using a bigger batch size took longer than the one using a smaller batch size: 13195ms vs 12876ms. If we have a look at the sum of GC pauses we can observe that the execution using a bigger batch size took longer too: 36.999ms vs 34.925ms.
Heap details
We might be wondering what’s the difference in heap terms. To answer that question we can re-run the executions enabling JFR recording. To be able to register TLAB events we’ll extend the default profile for JFR recording resulting in the following diff:
diff -u $JAVA_HOME/lib/jfr/default.jfc tlab_profile.jfc
@@ -640,12 +640,12 @@
     </event>

     <event name="jdk.ObjectAllocationInNewTLAB">
-      <setting name="enabled" control="gc-enabled-high">false</setting>
+      <setting name="enabled" control="gc-enabled-high">true</setting>
       <setting name="stackTrace">true</setting>
     </event>

     <event name="jdk.ObjectAllocationOutsideTLAB">
-      <setting name="enabled" control="gc-enabled-high">false</setting>
+      <setting name="enabled" control="gc-enabled-high">true</setting>
       <setting name="stackTrace">true</setting>
     </event>
Enter fullscreen mode Exit fullscreen mode
$ java -Xmx3g -XX:StartFlightRecording=filename=flight1.jfr,settings=tlab_profile.jfc Benchmark.java 30000000 100000
Enter fullscreen mode Exit fullscreen mode
$ java -Xmx3g -XX:StartFlightRecording=filename=flight2.jfr,settings=tlab_profile.jfc Benchmark.java 30000000 1000
Enter fullscreen mode Exit fullscreen mode
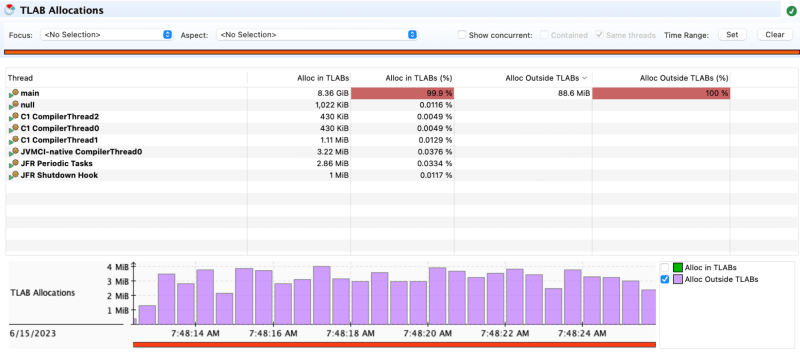
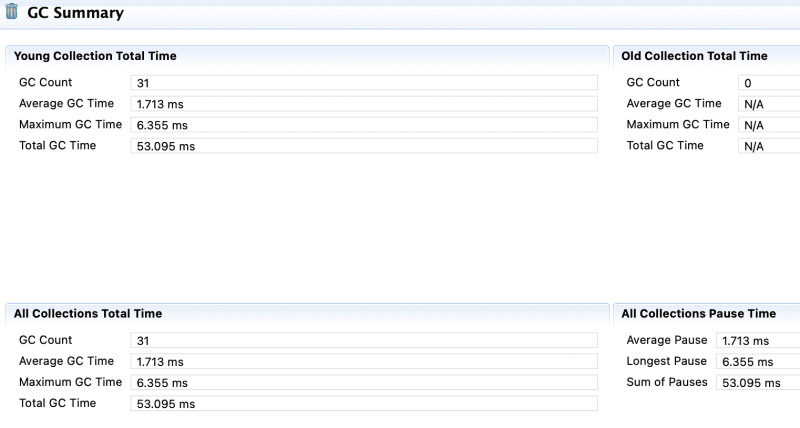
After getting the two recordings we observe that the main difference lies on allocations outside of TLAB. These allocations are more expensive than allocations in TLAB and can make a difference adding a considerable penalty to our execution time. In this case we observe a difference in Total GC Time of 53,1ms – 30,5ms = 22,6ms.
The issue here is we’re creating big objects (array of strings) because of the batch size. So once the batch is bigger than what can be allocated inside a TLAB we start seeing allocations outside of TLAB which will add pressure to the heap making our execution slower.


暂无评论内容